A recent issue arose for a client where the number of requests to their ASPNet Session State Database would drastically increase during peak load. Another symptom was a significant number of LCK_M_U lock types resulting from calls to TempGetStateItemExclusive3, a stored procedure in the ASPNet database.
Attempts to Google for the issue would almost always lead to articles that addressed the DeleteExpiredSessions stored proc. In this case, however, all indications where that DeleteExpiredSessions was not contibuting to this problem.
It turned out that the large amounts of data being stored in the Session object were getting dragged around on every request as described by Marc Gravell. A coworker pointed out this MSDN blog entry showing how to examine the contents of the ASPNet rows.
The symptoms showed up to me as lots of LCK_M_U type locks and excessing TempGetStateItemExclusive3 calls. Perhaps because of the tools I was using, I saw different symptoms than most and therefore found searching online to be of little help.
Wednesday, January 27, 2010
Tuesday, December 8, 2009
References
I have cited the following works in my blog:
Ben-Gan, I 2006, Using the RECOMPILE Query Hint to Solve Parameter Sniffing Problems, SQL Server Magazine, USA, viewed 6 December 2009, <http://www.sqlmag.com/Articles/ArticleID/94369/94369.html?Ad=1>
Delaney, K, Randal, P, Tripp, K, Cunningham, C, Machanic, A, Nevarez, B 2009, Microsoft® SQL Server™ 2008 Internals, Microsoft Press, Redmond Washington.
Delaney, K, Agarwal, S, Freedman, C, Machanic, A, Talmage, R 2008, Inside Microsoft® SQL Server™ 2005: Query Tuning and Optimization, Microsoft Press, Redmond Washington.
Monday, December 7, 2009
Why Does SQL Server Management Studio Run Queries So Much Faster Than My Application
One technique for troubleshooting SQL Server Performance Issues is to find a query that is slowing down your application using SQL Profiler and then paste it into SQL Server Management Studio to see the Query Plan. There are situations in which the query takes a very long time to complete when executed by the application but Management Studio takes only a fraction of the time. If large tables are involved, the difference can be minutes versus seconds. It calls into question whether Management Studio is showing the Query Plan that the application is using and therefore whether the troubleshooting effort is going to be wasted.
Some of the default settings for SQL Server Management Studio can cause it to seemingly outperform an application executing the same query by orders of magnitude. At the core are the Set Options such as ANSI_PADDING and ARITH_ABORT. These Set Options change the behavior of SQL Server for the current session. They can be set by a T-SQL SET statement (i.e. SET ARITHABORT ON) or configured in the SQL Server Management Studio under the Tools/Options menu option. In the case of SQL Server 2008, look under Query Execution, SQL Server, Advanced. The screen will look similar to the following:

Different Set Option values require different Query Plans because the steps to accommodate the options are different. It is when the Set Options in use by the application differ than those in use by Management Studio that two or more Query Plans are created. "Executing the same batches from these two different clients will result in multiple plans in cache" (Delaney 2008, p. 305).
As you can see in the screenshot above/left, the SET ARITHABORT (among others) is checked. This may be different than the default Set Options for a given application and its OleDB (or similar) drivers.
It is worth taking a moment to explain that the setting for ARITHABORT would not likely have sped up or slowed down an application. It simply caused another Query Plan to be created, which was optimized for the values passed in. For example, the original Query Plan may have been optimized for California because that was the value passed in when the plan was created. The application and underlying query may perform poorly when Kentucky is specified (Ben-Gan 2006). Executing the query for Kentucky from within Management Studio with different Set Options causes another plan to be created. This time it is optimized for Kentucky in particular and therefore much faster given that value.
The query executed by the application and captured from SQL Profiler may be as simple as the following:
To see how many Query Plans are currently cached for this query, the following SQL can be used:
The results show one query plan

If that same query is executed from within SQL Server Management Studio, the results may change:

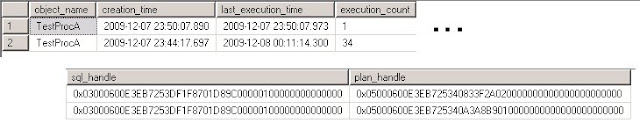
The results show that there are now two query plans. The sql_handle values are identical indicating the exact same query was issued. The plan_handle values are different, one for each Query Plan. Since the stored procedure was only invoked once from SQL Server Management Studio, the execution_count value of 1 indicates the Query Plan that was just created by executing it within Management Studio. The 33 other invocations were from the application.
The Plan_handle in the results is a unique identifier for the cached Query Plan that is created by appending several values together. The ObjectId of the stored procedure is part of the key. There is a value indicating the type of user too. Most importantly, the Set Options are represented by bits in the Set Options field.
The following SQL has the Plan_Handle from the results above pasted in and reveals what comprises the Plan_Handle:
The results are as follows:

Notice that the only difference is the set_options. In order to see what bit(s) are different between the values 4347 and 251, it helps to open the CALC application and view each in binary. In this case, it is:
This difference in decimal is 4096. There is a great article HERE that shows the decimal values and option they equate to. In this case, it is ARITH_ABORT.
I can set the ARITH_ABORT to off before executing my query as in:
The results are as follows:
As you can see from examining the execution_count, changing the Set Options in Management Studio to match those of the application caused it to use the same Query Plan as the application. Otherwise the newer (top) plan's execution count would have been incremented to 2. I assure you it performed horribly (a good thing). The discrepancy is gone and I can now troubleshoot this query from the comfort of Management Studio. Configuring the SET options in Management Studio's Toos/Optimize screens can save time since it is not neccesary to type the SET statement at the start of every performance tuning session.
General notes:
There are queries to retrieve the actual query plan executed by the application which bypasses the need to concern oneself with Set Options or Plan Handles. In fact, I use a variation of one of them above. However, if it is going to take several fix/test iterations to solve the problem, then recreating the issue in the application, executing a query, saving the results as a Query Plan (.sqlplan file) and loading it up for viewing is going to be very arduous. The Show Actual Execution Plan button (Query Plan for our purposes) in SQL Server Management Studio is going prove to be much faster.
Although not the focus of this section, there are other situations that can cause discrepancies such as this:
One possible explanation is the speed improvements provided by the Buffer Cache in back to back executions of a query. To clarify, the Buffer Cache significantly speeds up subsequent executions of a query by storing the Data Pages the query needs in memory. There are instances, however, when this does not explain the discrepancy, such as when the part of the application that executes the query is tried again and again without improvement. All this after seeing the same query perform with lightning speed in SQL Server Management Studio. In this case, it makes sense to consider the possibility that Set Options are causing the discrepancy.
Another possible explanation is slight differences in the text of an ad-hoc query such as upper/lower case or extra carriage returns in the query text. These slight differences can create different plans. "If one query uses a different case for either identifiers or keywords, even in a database with a case-insensitive collation, the queries are not the same" (Delaney 2009, p.529). Simple SQL with a stored procedure invocation would not be affected by this. SQL Profiler's Extract Event Data option is good for capturing the exact text, but even with the exact query text, SQL Sever Management Studio may still suffer from the Set Options issue described above.
References:
Ben-Gan, I 2006, Using the RECOMPILE Query Hint to Solve Parameter Sniffing Problems, SQL Server Magazine, USA, viewed 6 December 2009, <http://www.sqlmag.com/Articles/ArticleID/94369/94369.html?Ad=1>
Delaney, K, Randal, P, Tripp, K, Cunningham, C, Machanic, A, Nevarez, B 2009, Microsoft® SQL Server™ 2008 Internals, Microsoft Press, Redmond Washington.
Delaney, K, Agarwal, S, Freedman, C, Machanic, A, Talmage, R 2008, Inside Microsoft® SQL Server™ 2005: Query Tuning and Optimization, Microsoft Press, Redmond Washington.
Some of the default settings for SQL Server Management Studio can cause it to seemingly outperform an application executing the same query by orders of magnitude. At the core are the Set Options such as ANSI_PADDING and ARITH_ABORT. These Set Options change the behavior of SQL Server for the current session. They can be set by a T-SQL SET statement (i.e. SET ARITHABORT ON) or configured in the SQL Server Management Studio under the Tools/Options menu option. In the case of SQL Server 2008, look under Query Execution, SQL Server, Advanced. The screen will look similar to the following:

Different Set Option values require different Query Plans because the steps to accommodate the options are different. It is when the Set Options in use by the application differ than those in use by Management Studio that two or more Query Plans are created. "Executing the same batches from these two different clients will result in multiple plans in cache" (Delaney 2008, p. 305).
As you can see in the screenshot above/left, the SET ARITHABORT (among others) is checked. This may be different than the default Set Options for a given application and its OleDB (or similar) drivers.
It is worth taking a moment to explain that the setting for ARITHABORT would not likely have sped up or slowed down an application. It simply caused another Query Plan to be created, which was optimized for the values passed in. For example, the original Query Plan may have been optimized for California because that was the value passed in when the plan was created. The application and underlying query may perform poorly when Kentucky is specified (Ben-Gan 2006). Executing the query for Kentucky from within Management Studio with different Set Options causes another plan to be created. This time it is optimized for Kentucky in particular and therefore much faster given that value.
The query executed by the application and captured from SQL Profiler may be as simple as the following:
exec TestProcA,'Kentucky'To see how many Query Plans are currently cached for this query, the following SQL can be used:
SELECT Object_name(st.objectid, st.dbid) AS [object_name]

    ,qs.creation_time

    ,qs.last_execution_time

    ,qs.execution_count

    ,qs.sql_handle

    ,qs.plan_handle

FROM sys.dm_exec_query_stats qs

CROSS APPLY sys.Dm_exec_sql_text(qs.sql_handle) st

WHERE Object_name(st.objectid, st.dbid) = 'TestProcA'

  AND Db_name(st.dbid) = 'foo_db'
The results show one query plan

If that same query is executed from within SQL Server Management Studio, the results may change:

The Plan_handle in the results is a unique identifier for the cached Query Plan that is created by appending several values together. The ObjectId of the stored procedure is part of the key. There is a value indicating the type of user too. Most importantly, the Set Options are represented by bits in the Set Options field.
The following SQL has the Plan_Handle from the results above pasted in and reveals what comprises the Plan_Handle:
SELECT *

FROM sys.Dm_exec_plan_attributes(0x05000600E3EB725340833F2A020000000000000000000000)

WHERE is_cache_key = 1


SELECT *

FROM sys.Dm_exec_plan_attributes(0x05000600E3EB725340A3A8B9010000000000000000000000)

WHERE is_cache_key = 1
The results are as follows:

Notice that the only difference is the set_options. In order to see what bit(s) are different between the values 4347 and 251, it helps to open the CALC application and view each in binary. In this case, it is:
I can set the ARITH_ABORT to off before executing my query as in:
SET arithabort OFF

EXEC Testproca 1862 ,'Kentucky'
The results are as follows:

As you can see from examining the execution_count, changing the Set Options in Management Studio to match those of the application caused it to use the same Query Plan as the application. Otherwise the newer (top) plan's execution count would have been incremented to 2. I assure you it performed horribly (a good thing). The discrepancy is gone and I can now troubleshoot this query from the comfort of Management Studio. Configuring the SET options in Management Studio's Toos/Optimize screens can save time since it is not neccesary to type the SET statement at the start of every performance tuning session.
General notes:
There are queries to retrieve the actual query plan executed by the application which bypasses the need to concern oneself with Set Options or Plan Handles. In fact, I use a variation of one of them above. However, if it is going to take several fix/test iterations to solve the problem, then recreating the issue in the application, executing a query, saving the results as a Query Plan (.sqlplan file) and loading it up for viewing is going to be very arduous. The Show Actual Execution Plan button (Query Plan for our purposes) in SQL Server Management Studio is going prove to be much faster.
Although not the focus of this section, there are other situations that can cause discrepancies such as this:
One possible explanation is the speed improvements provided by the Buffer Cache in back to back executions of a query. To clarify, the Buffer Cache significantly speeds up subsequent executions of a query by storing the Data Pages the query needs in memory. There are instances, however, when this does not explain the discrepancy, such as when the part of the application that executes the query is tried again and again without improvement. All this after seeing the same query perform with lightning speed in SQL Server Management Studio. In this case, it makes sense to consider the possibility that Set Options are causing the discrepancy.
Another possible explanation is slight differences in the text of an ad-hoc query such as upper/lower case or extra carriage returns in the query text. These slight differences can create different plans. "If one query uses a different case for either identifiers or keywords, even in a database with a case-insensitive collation, the queries are not the same" (Delaney 2009, p.529). Simple SQL with a stored procedure invocation would not be affected by this. SQL Profiler's Extract Event Data option is good for capturing the exact text, but even with the exact query text, SQL Sever Management Studio may still suffer from the Set Options issue described above.
References:
Ben-Gan, I 2006, Using the RECOMPILE Query Hint to Solve Parameter Sniffing Problems, SQL Server Magazine, USA, viewed 6 December 2009, <http://www.sqlmag.com/Articles/ArticleID/94369/94369.html?Ad=1>
Delaney, K, Randal, P, Tripp, K, Cunningham, C, Machanic, A, Nevarez, B 2009, Microsoft® SQL Server™ 2008 Internals, Microsoft Press, Redmond Washington.
Delaney, K, Agarwal, S, Freedman, C, Machanic, A, Talmage, R 2008, Inside Microsoft® SQL Server™ 2005: Query Tuning and Optimization, Microsoft Press, Redmond Washington.
Tuesday, November 17, 2009
Hourly Execution Statistics from the dm_exec_query_stats DMV
The dm_exec_query_stats dynamic management view (DMV) provides copious amounts of data about how often queries are executed and how much resources they consume. One such value, execution_count, indicates how many times the stored procedure or query was executed. Unfortunately (and probably unavoidably), this value is aggregated. In other words, it counts all executions of a stored procedure or SQL back until the server was last (re) started or certain commands were executed (i.e. DBCC FreeProcCache).
There are many times when what is needed is an hourly breakdown of executions or resources used throughout the day. There are monitoring tools that can provide this, but here is a simple explanation of how to get stats on a particular stored procedure, in this case for ASP Session State, that provides such a breakdown.
The basic idea is to schedule a hourly recurring SQL Server Job to gather the output from dm_exec_query_stats DMV and store it in a table. Then another query can do some math and format the results for display.
This script can be used to create a table to hold the output from dm_exec_query_stats at a given moment.
This script can be placed in an hourly recurring SQL Server job to take a sampling of the values from dm_exec_query_stats and insert it in the table. See how to create a job Here.
) as sr1 on sr1.id = (select max(id) from [pt].[dbo].[StatisticsSProcRaw] where id < sr.id and object_name = sr.object_name)
ORDER BY sr.id desc
This script is subtracting from a set of values (the sr alias) what the values were on the previous record (the sr1 alias). It does this by doing a self-join to the same table. With a small enough table, this is actually efficient. As the size of the table grows, this SQL will need to be re-evaluated, the table truncated or a more complicated aggregation scheme devised.
Here is some sample output:

With this, I can see the execution_count slowly winding down after the dinner hour.
There are many times when what is needed is an hourly breakdown of executions or resources used throughout the day. There are monitoring tools that can provide this, but here is a simple explanation of how to get stats on a particular stored procedure, in this case for ASP Session State, that provides such a breakdown.
The basic idea is to schedule a hourly recurring SQL Server Job to gather the output from dm_exec_query_stats DMV and store it in a table. Then another query can do some math and format the results for display.
This script can be used to create a table to hold the output from dm_exec_query_stats at a given moment.
CREATE TABLE [dbo].[StatisticsSProcRaw](

  [id] [int] IDENTITY(1,1) NOT NULL,

  [object_name] [nvarchar](50) NOT NULL,

  [date] [datetime] NOT NULL,

  [execution_count] [int] NULL,

  [time_blocked] [int] NULL,

  [avg_cpu_cycles] [int] NULL,

  [total_logical_reads] [int] NULL,

  [total_logical_writes] [int] NULL,

  [total_logical_io] [int] NULL,

 CONSTRAINT [PK_Statistics_Raw] PRIMARY KEY NONCLUSTERED

(

  [id] ASC

)WITH (PAD_INDEX  = OFF, STATISTICS_NORECOMPUTE  = OFF, IGNORE_DUP_KEY = OFF, ALLOW_ROW_LOCKS  = ON, ALLOW_PAGE_LOCKS  = ON) ON [PRIMARY]

) ON [PRIMARY]
This script can be placed in an hourly recurring SQL Server job to take a sampling of the values from dm_exec_query_stats and insert it in the table. See how to create a job Here.
insert into StatisticsSProcRaw

  ([object_name]

  ,date

  ,execution_count

  ,time_blocked

  ,avg_cpu_cycles

  ,total_logical_reads

  ,total_logical_writes

  ,total_logical_io

  )

select

   object_name(st.objectid, st.dbid) as [object_name]

  ,GetDate()

  ,qs.execution_count

  ,total_elapsed_time - total_worker_time as time_blocked

  ,total_worker_time / qs.execution_count as avg_cpu_cycles

  ,qs.total_logical_reads

  ,qs.total_logical_writes

  ,qs.total_logical_reads + qs.total_logical_writes as total_logical_io

from sys.dm_exec_query_stats qs

cross apply sys.dm_exec_sql_text(qs.sql_handle) st

where st.dbid is not null

  and DB_Name(st.dbid) = 'ASPState'

  and object_name(st.objectid, st.dbid) = 'TempGetStateItemExclusive3'


This script does the math to figure out how much the values have changed and formats the results.  It saves one from running the DMV every hour and pasting the results into Excel to get the deltas since the DMV numbers just go up and up.
SELECT TOP 100

       sr.[object_name]

      ,convert(varchar,sr1.[date],108) as start_time

      ,convert(varchar,sr.[date], 108) as end_time

      ,sr.[execution_count] - sr1.[execution_count] as [execution_count]

      ,sr.[time_blocked] - sr1.[time_blocked] as [time_blocked]

      ,sr.[avg_cpu_cycles]

      ,sr.[total_logical_reads] - sr1.[total_logical_reads] as [logical_reads]

      ,sr.[total_logical_writes] - sr1.[total_logical_writes] as [logical_writes]

      ,sr.[total_logical_io] - sr1.[total_logical_io] as [logical_io]

FROM [pt].[dbo].[StatisticsSProcRaw] sr

JOIN

(

SELECT sr2.[id]

    ,sr2.[object_name]

      ,sr2.[date]

      ,sr2.[execution_count]

      ,sr2.[time_blocked]

      ,sr2.[avg_cpu_cycles]

      ,sr2.[total_logical_reads]

      ,sr2.[total_logical_writes]

      ,sr2.[total_logical_io]

FROM [pt].[dbo].[StatisticsSProcRaw] sr2

--) as sr1 on sr1.id = (sr.id - 1)  --faster, but fails for non-sequential ids
) as sr1 on sr1.id = (select max(id) from [pt].[dbo].[StatisticsSProcRaw] where id < sr.id and object_name = sr.object_name)
ORDER BY sr.id desc
This script is subtracting from a set of values (the sr alias) what the values were on the previous record (the sr1 alias). It does this by doing a self-join to the same table. With a small enough table, this is actually efficient. As the size of the table grows, this SQL will need to be re-evaluated, the table truncated or a more complicated aggregation scheme devised.
Here is some sample output:

Wednesday, November 11, 2009
Currently Executing SQL Queries
Here is some handy SQL to determine the queries currently executing on your SQL Server (limited to the longest running 10 queries). It samples only an instant in time, so there may be fewer rows returned than you might expect. The Activity Monitor in SQL Management Studio has a similar view. However, I like keeping this handy because when the server is really in trouble, Activity Monitor may take a very long time to start up.
SELECT TOP 10

  Substring(TEXT, (statement_start_offset/2) + 1, ((CASE statement_end_offset WHEN -1 THEN Datalength(TEXT) ELSE statement_end_offset END - statement_start_offset)/2)+1) AS query_text

  ,logical_reads

  ,reads

  ,writes

  ,er.total_elapsed_time

  ,Db_name(database_id) AS [database]

  ,Object_name(objectid, database_id) AS object_name

  , *

FROM sys.dm_exec_requests er

CROSS APPLY sys.Dm_exec_sql_text(sql_handle)

ORDER BY er.total_elapsed_time DESCIntroduction
Kurt Vonnegut spoke at my university in 1988. He said that the best way to engage your readers was to throw away the first 10 pages of your manuscript. He said those pages were almost always useless, boring fluff. So let us dive right in.
How hard it is to diagnose a SQL Server performance issue depends somewhat on the immediacy of the problem. Did you receive a phone call about a problem happening right now? Or did one of the salespeople in your company tell you about a demo earlier in the day where the application was abnormally slow? It is easier to find the cause of the problem if it is happening now or can easily be reproduced since there is an opportunity to start up database monitors to help spot the problem.
In this blog, I will start with monitors that show a more immediate view of what is happening on the database and work towards unattended, long running monitors that can reveal what happened on a particular moment on any day. I chose that order because unattended monitors take much longer to set up.
Subscribe to:
Posts (Atom)